
Knowing what does cost per engagement mean helps you judge whether a campaign is actually working.
TL;DR:
- Cost per engagement measures how much you pay for each user interaction with your ad or content.
- It is most useful for campaigns focused on user interactions rather than direct conversions or reach.
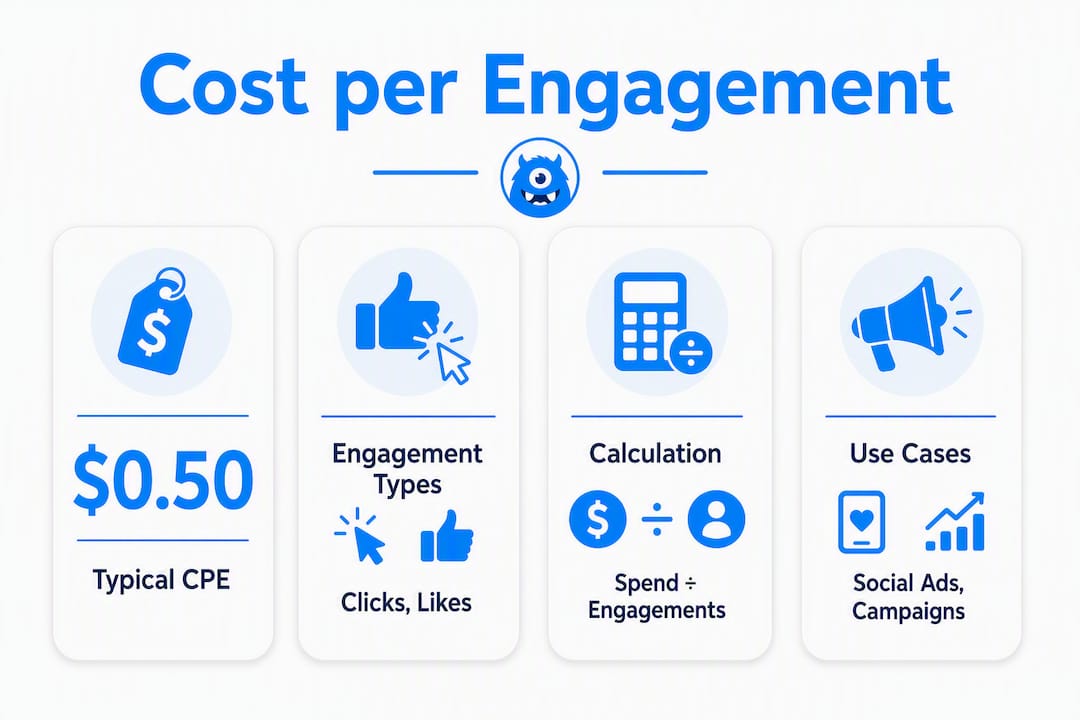
Cost per engagement (CPE) measures how much you pay each time a user actively interacts with your ad or content. The formula is straightforward:
CPE = total spend ÷ total engagements
CPE is the right pricing metric when your campaign goal is interaction rather than traffic or purchase. If you are running an awareness or social proof campaign on Meta (Facebook and Instagram Ads), TikTok Ads, YouTube/Google Ads, or LinkedIn Ads, CPE tells you exactly what each meaningful reaction costs. Tools like AppsFlyer extend this into in-app environments where engagement events can be mapped to downstream conversions.
The cost per engagement definition from Sprinklr puts it plainly: you pay only when a user interacts, not simply when they see the ad. That single distinction separates CPE from impression-based models and makes it particularly useful for campaigns where passive reach is not enough.
Key platforms and tools covered in this guide:
- Meta (Facebook & Instagram Ads): post reactions, comments, shares, saves, video views
- TikTok Ads: likes, comments, shares, profile visits, video completions
- YouTube/Google Ads: earned actions, card clicks, playlist additions, channel subscriptions
- LinkedIn Ads: reactions, comments, shares, follows, clicks on sponsored content
- AppsFlyer: in-app engagement events mapped to campaign spend
Table of Contents
- Which actions do platforms actually count as an engagement?
- How to calculate CPE: formula, worked example and data notes
- How CPE compares with CPC, CPA and CPM
- When should you use CPE, and what are the trade-offs?
- UK CPE benchmarks: what the numbers actually mean
- How to track, validate and improve your CPE
- What UK small businesses should do with CPE data
- Key takeaways
- CPE is only as good as what you define it to measure
- Useful sources
- FAQ
Which actions do platforms actually count as an engagement?
The word “engagement” sounds universal. It is not. Each platform draws the line differently, and if you do not define what counts before a campaign launches, you will end up optimising for actions that cost little because they mean little.

Typical engagement types across platforms include likes, comments, shares, clicks, video views, saves, story taps, poll responses, and app events. The variety of interactions platforms treat as engagements ranges from a two-second video pause to a form submission, and AppsFlyer is explicit that engagement should be tailored to your business goals rather than accepted at the platform’s default.
| Platform | Common engagement types | High-value examples |
|---|---|---|
| Meta (Facebook & Instagram) | Reactions, comments, shares, saves, video views, link clicks | Saves, shares, click-to-website |
| TikTok Ads | Likes, comments, shares, profile visits, video completions | Shares, profile visits, completions |
| YouTube/Google Ads | Earned views, card clicks, playlist adds, subscriptions | Subscriptions, card clicks |
| LinkedIn Ads | Reactions, comments, shares, follows, clicks | Follows, click-throughs on lead gen |
| AppsFlyer (in-app) | App opens, tutorial completions, in-app purchases | Tutorial completions, purchases |
The gap between a reaction and a share is enormous in terms of intent. A reaction takes one tap; a share means the user thought the content was worth putting in front of their own audience. Treating both as equal engagements in your CPE calculation produces a number that flatters the campaign without reflecting its real impact.
For a broader breakdown of what different engagement types signal, the types of engagement metrics for small brands guide covers the business meaning behind each.
Pro Tip: Before launch, write down your “valid engagement” definition in the campaign brief. Map it to the specific event in your platform’s reporting interface. If the platform counts pauses or accidental taps by default, exclude them from your CPE calculation using event filters.
How to calculate CPE: formula, worked example and data notes
The formula stays the same regardless of platform:
CPE = amount spent ÷ number of engagements

Each term matters. Amount spent is the total budget consumed in the reporting window, not the budget allocated. Number of engagements should reflect only the valid interactions you defined before launch.
Worked example:
- You run a Meta campaign with a defined budget.
- The campaign generates thousands of post engagements (reactions, comments, shares, saves).
- CPE = total spend divided by total engagements to calculate cost per engagement.
Now suppose you narrow the definition to shares and saves only, which are fewer in number.
CPE (high-value only) = total spend divided by counted high-value engagements to measure cost per meaningful engagement.
Both numbers are correct. The second is more useful because it reflects interactions with genuine downstream potential.
| Data-pull consideration | Why it matters |
|---|---|
| Consistent time window | Spend and engagement counts must cover the same dates |
| Deduplication | One user liking and sharing counts as two engagements; decide in advance whether that is correct |
| Bot/invalid activity exclusion | Platform fraud filters vary; AppsFlyer’s SDK-level tracking provides cleaner in-app data |
| Engagement type filter | Pull only the event types you defined as valid |
Search Engine Land notes that CPE will typically be lower than CPC because all clicks are engagements but not all engagements are clicks. The exception: if clicks are the only event you track, CPE equals CPC exactly.
How CPE compares with CPC, CPA and CPM
Choosing the wrong pricing metric for your objective is one of the most common budget mistakes in paid social. The table below maps each model to what it actually measures.
| Metric | What it measures | Business goal alignment | Best campaign types | Quality validation |
|---|---|---|---|---|
| CPE | User interaction (like, share, view, tap) | Awareness, social proof, engagement | Social campaigns, video, influencer | Monitor alongside ROAS/CPA |
| CPC | Click to destination | Traffic, lead generation | Search, display, retargeting | Landing page conversion rate |
| CPA | Completed conversion (purchase, sign-up) | Revenue, lead volume | Performance max, conversion campaigns | Direct revenue attribution |
| CPM | Impressions served | Reach, brand awareness | Broad awareness, video reach | Frequency and brand recall |
Wikipedia’s entry on cost-per-engagement frames CPE as sitting between awareness and conversion goals, which is accurate. It captures the interactions that CPM misses (passive views) without demanding the purchase commitment that CPA requires.
A few practical rules:
- Use CPE when you need proof of interest: social proof campaigns, video storytelling, community building.
- Use CPC when the destination matters: driving traffic to a landing page or product page.
- Use CPA when the only result that counts is a conversion.
- Use CPM when reach and frequency are the objective and you trust your creative to do the work.
CPE can equal CPC in campaigns where the only tracked engagement is a click. If that is your setup, the two metrics are interchangeable and there is no analytical advantage to reporting CPE separately.
When should you use CPE, and what are the trade-offs?
CPE suits campaigns where user interest is the deliverable. Paying only for interactions means that if your ad fails to connect, you pay nothing. That low-risk structure is why Mailchimp recommends CPE campaigns for small businesses testing new creative or entering new audiences.
Advantages:
- Budget flows to content that generates genuine interest, not passive impressions.
- Useful for building social proof: visible likes and comments increase perceived credibility for future visitors.
- Aligns spend with user intent signals rather than reach alone.
- Low financial risk when creative is unproven.
Drawbacks:
- Engagements vary wildly in quality. A two-second video pause and a share are not equivalent signals.
- CPE says nothing about whether engagements convert. A campaign with a £0.05 CPE and zero downstream purchases is not a success.
- Platforms may count low-value interactions by default, inflating engagement counts and flattering the metric.
Risk mitigation:
- Define meaningful engagements before launch and filter out low-value events.
- Monitor CPE alongside ROAS and CPA to confirm that interactions lead to business results.
- Set a minimum engagement quality threshold: if a campaign’s share-to-reaction ratio falls below your benchmark, pause and reassess creative.
Pro Tip: CPE functions as a social-proof lever as well as a cost metric. Paid engagements increase visible counts (likes, comments, shares) that can improve organic reach and perceived credibility for future visitors to your page or profile.
UK CPE benchmarks: what the numbers actually mean
There is no single “good” CPE. Benchmarks vary by platform, ad format, audience, creative type, and campaign objective. UK audiences tend to be smaller and more competitive than US equivalents, which pushes CPE upward on platforms where auction dynamics are tighter.
Typical UK campaigns show variation in CPE by platform and engagement type. Meta platforms often have lower engagement costs for video and carousel formats, with higher costs for lead-generation interactions. TikTok usually sees lower CPE for video completions and likes but higher for shares and profile visits. LinkedIn engagement costs are higher, reflecting its professional audience and premium inventory. YouTube and Google Ads charge more for earned actions like subscriptions and card clicks compared to passive views.
These are directional ranges, not guarantees. A niche B2B audience on LinkedIn will produce a very different CPE from a broad consumer campaign on TikTok.
Caveats that matter more than the number itself:
- Audience targeting intensity: the tighter the targeting, the higher the CPE.
- Creative format: video typically generates more engagements per pound than static images.
- Seasonality: Q4 auction pressure raises CPE across all platforms for UK advertisers.
- Platform engagement definitions: a LinkedIn “engagement” and a TikTok “engagement” are not comparable events.
UK marketers should report CPE in GBP and segment by platform in dashboards. Blending CPE across platforms produces a figure that is arithmetically correct but analytically useless.
Pro Tip: Rather than benchmarking your CPE against an industry average, track your own CPE trend over four to six weeks and compare it against CPA and ROAS movement in the same period. A rising CPE alongside a stable CPA is fine. A falling CPE alongside a rising CPA is a warning sign.
How to track, validate and improve your CPE
Measurement without validation produces false confidence. Follow this sequence for clean CPE data.
- Define valid engagement events in your campaign brief before any spend goes live.
- Set up event tracking in Ads Manager (Meta), Google Ads reporting, or AppsFlyer for in-app events.
- Pull spend and engagement data for the same date range. Mismatched windows are the most common source of CPE calculation errors.
- Deduplicate where necessary. Decide whether one user liking and sharing the same post counts as one engagement or two, and apply that rule consistently.
- Exclude invalid activity. Use platform fraud filters and, for in-app campaigns, AppsFlyer’s SDK-level validation to remove bot signals.
- Map engagements to conversion events. A CPE figure without a downstream conversion rate attached to it is incomplete.
Optimisation tactics:
- A/B test creative formats: video vs. static, short-form vs. long-form, single image vs. carousel.
- Refine audiences using lookalikes built from your highest-engagement segments.
- Test placement: Stories placements on Meta often produce lower CPE than Feed for certain creative types.
- Run conversion-lift tests to confirm that engaged users convert at a higher rate than non-engaged users.
- Use retargeting to re-engage users who interacted but did not convert.
For broader growth tactics that complement CPE optimisation, the social proof strategies guide outlines how visible engagement signals compound over time.
Pro Tip: Test paying for a stricter engagement event, such as a click-to-landing-page, and compare its downstream CPA against a broader engagement event like a reaction. The stricter event will cost more per engagement but often delivers a lower CPA, making it the better buy.
What UK small businesses should do with CPE data
Small teams do not need complex attribution models to use CPE well. They need a clear setup, a consistent reporting cadence, and the discipline to act on what the data shows.
Campaign setup checklist:
- Define one primary engagement event per campaign (not five).
- Set a CPE target before launch based on your content budget and expected engagement volume.
- Use platform-native reporting first; add AppsFlyer or a third-party tool only when in-app events are involved.
- Segment campaigns by platform from day one; never blend spend across Meta and LinkedIn in a single report.
Budget allocation guidance:
- Allocate the majority of your social budget to conversion-objective campaigns focused on CPA/ROAS.
- Reserve a smaller portion for engagement-objective campaigns to build social proof and test creative.
- Within the engagement budget, test multiple creative variants from the start.
- After some time, shift budget toward the variant with better performance in CPE and downstream conversion rates.
UK market notes:
- UK audiences on Meta are smaller than US equivalents, so frequency caps matter more. Set a frequency cap of 3–4 impressions per user per week to avoid audience fatigue.
- Regional targeting (London vs. the rest of the UK) can produce materially different CPEs for the same creative.
- Q4 (October–December) raises CPE across all platforms due to auction competition. Plan budgets accordingly.
For small businesses with limited analytics resources, Mailchimp’s guidance recommends weekly dashboard checks comparing CPE against CPA rather than daily monitoring, which reduces overreaction to short-term fluctuations.
If you are weighing whether paid engagement or organic growth better suits your current stage, the paid engagement versus organic growth breakdown covers the trade-offs directly.
Key takeaways
CPE is a useful metric only when the engagement you are paying for is defined precisely and monitored alongside conversion outcomes.
| Point | Details |
|---|---|
| CPE formula | Divide total spend by total valid engagements: CPE = spend ÷ engagements. |
| Platform definitions differ | Meta, TikTok, YouTube, and LinkedIn each count different actions; align your definition before launch. |
| CPE vs CPC | CPE is typically lower than CPC because not all engagements are clicks; they are equal only when clicks are the sole tracked event. |
| Benchmark with caution | UK CPE varies widely by platform, format, and audience; track your own trend against CPA/ROAS rather than industry averages. |
| One action to take now | Run a two-week test comparing a broad engagement event against a click-to-landing event, then compare the downstream CPA of each. |
CPE is only as good as what you define it to measure
Most marketers who struggle with CPE are not struggling with the maths. They are struggling with the definition. A campaign that generates thousands of reactions at £0.02 each looks excellent on a CPE report and can be entirely worthless if those reactions come from users who have no interest in buying, following, or returning.
The metric itself is sound. Pay for interaction, not passive reach. That principle holds. The problem is that “interaction” is doing a lot of heavy lifting in that sentence, and platforms are not incentivised to make the definition strict on your behalf.
My recommendation: treat CPE as a diagnostic tool rather than a success metric. Use it to identify which creative formats and audience segments generate the most interest per pound spent, then validate that interest by tracking what those engaged users do next. If they convert at a rate that justifies the spend, scale. If they do not, the low CPE is a distraction.
For UK teams specifically, the combination of smaller addressable audiences and higher Q4 auction pressure means that a CPE that looks healthy in July can look very different in November. Build seasonality into your benchmarks from the start.
Greediersocialmedia has supported over a million UK users since 2013, and the pattern we see consistently is that engagement quality compounds. Real interactions from genuinely interested users build social proof for influencers and brands that attracts further organic engagement over time. That compounding effect is what makes a well-managed CPE strategy worth the effort.
If you want to put this into practice, explore Greediersocialmedia’s social media growth tactics for UK brands looking to build genuine engagement at scale.
Useful sources
The sources below are worth bookmarking for platform-specific engagement definitions and CPE measurement guidance:
- Cost per engagement (CPE) definition — TechTarget: clear explanation of what counts as an engagement and the low-risk nature of the pricing model.
- What is cost per engagement (CPE)? — Sprinklr glossary: covers the formula, worked rationale, and the case for pairing CPE with ROAS.
- Cost per engagement (CPE) — AppsFlyer glossary: the most thorough treatment of in-app engagement tracking and validation checklists.
- CPE calculator and explanation — Search Engine Land: useful for the CPE/CPC equivalence point and quick calculations.
- Cost-per-engagement — Wikipedia: concise overview of how CPE sits between awareness and conversion metrics.
Always cross-reference CPE definitions against the platform’s own reporting interface (Meta Ads Manager, Google Ads, LinkedIn Campaign Manager, TikTok Ads Manager) because platform glossaries update more frequently than third-party sources.
FAQ
What does cost per engagement mean?
Cost per engagement (CPE) is an advertising pricing model where you pay each time a user actively interacts with your ad or content. Interactions can include likes, comments, shares, video views, saves, and clicks, depending on how you define valid engagements for the campaign.
How do you calculate cost per engagement?
Divide your total ad spend by the total number of valid engagements: CPE = amount spent ÷ engagements. For example, if your campaign generates thousands of post engagements, dividing your spend by those engagements calculates a meaningful CPE.
What is a good cost per engagement?
There is no universal benchmark. UK CPE varies significantly by platform, ad format, audience, and campaign objective. Track your own CPE trend over four to six weeks and compare it against CPA and ROAS rather than relying on a single industry figure.
How does CPE differ from CPC?
CPE measures any defined interaction (likes, shares, views), while CPC measures only clicks to a destination. CPE is typically lower than CPC because not all engagements are clicks. If clicks are the only event you track, CPE and CPC are equal.
Can CPE replace CPA as a success metric?
No. CPE measures user interest; CPA measures completed conversions. Use CPE alongside CPA and ROAS to confirm that engaged users actually convert, rather than treating a low CPE as proof of campaign success on its own.