
These examples of data driven content strategies show what separates guesswork from genuine planning.
A data-driven content strategy uses measurable signals, search demand, first-party behaviour, on-site experiments, and revenue attribution, to decide what you publish, how you format it, and where you push it out. It replaces guesswork with evidence at every stage: topic selection, brief, production, and distribution.
This article covers five distinct types of proof:
- A global brand’s on-site testing (Philips-style CTA and UX changes)
- Loyalty-data personalisation shaping content themes (Sephora)
- SEO-led evergreen content built from keyword and search-intent data (Ahrefs)
- Pillar-and-cluster architecture for scaling inbound (HubSpot)
- Product-led content tied directly to revenue (Toro)
Every example below comes with the specific signal that drove the decision and the outcome it produced, measured against pipeline contribution, signups, or conversion rate rather than vanity numbers like pageviews.
Key Takeaways
A data-driven content strategy works because it replaces guesses about what to publish with measurable signals from search demand, first-party behaviour, and revenue data.
| Point | Details |
|---|---|
| Test the mechanism, not just the copy | Adobe’s case showed a slide-in CTA lifted signups by 635%, proving delivery method matters as much as wording. |
| Loyalty data shapes relevance | Sephora segments content by purchase and engagement history rather than broad demographics. |
| Product-led content moves revenue | Toro grew branded inbound from roughly 5% to over 25% of revenue with buyer-problem content. |
| Distribution is part of the brief | Plan channel, timing, and format tests before publishing, not after. |
| Attribution beats vanity metrics | Map every content piece to pipeline or conversion data, not traffic alone. |
Table of Contents
- Examples of data driven content strategies that moved real numbers
- How to build a data-driven content workflow step by step
- Measuring success: KPIs, attribution and reporting that prove ROI
- Common pitfalls and quick fixes
- Where Greediersocialmedia fits into the data-driven picture
- What the evidence actually tells you to do first
- Sources
- FAQ
Examples of data driven content strategies that moved real numbers
Here are ten cases worth studying, each with the data point behind the decision and what changed as a result.
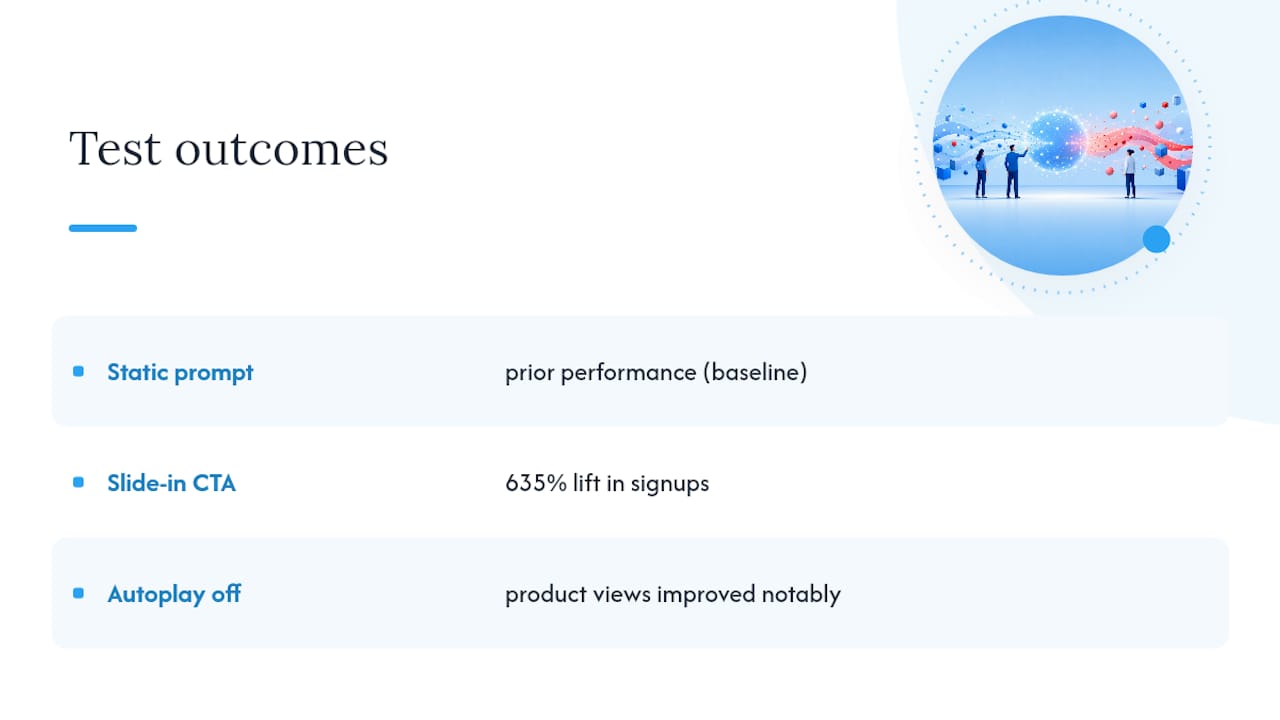
1. Philips-style CTA and autoplay tests. A widely cited Adobe case study found that swapping a static newsletter prompt for a slide-in CTA, triggered by scroll depth and exit intent, lifted signups by 635%. The same testing programme found that removing autoplay from product videos improved product view rates notably, because visitors chose to watch on their own terms rather than being interrupted. The lesson travels well beyond electronics retail: test the mechanism of a prompt, not just its wording.

2. Sephora’s loyalty-driven content segmentation. Sephora feeds behavioural and loyalty-tier data into decisions about which content themes reach which shoppers, tailoring email, mobile, and in-store messaging by purchase history and engagement level rather than broad demographics, according to G2’s breakdown of data-driven content strategy. A shopper who buys skincare every six weeks sees different editorial content than one who only buys during sale periods. The signal here isn’t “who is this person” but “what has this person already told us through their behaviour.”
3. Ahrefs’ data-backed evergreen studies. Ahrefs built much of its organic authority on original studies, using its own crawl and keyword data to answer questions competitors were guessing at (“how many words should a blog post be,” “how long does it take to rank”). Because the content answers a real, high-volume query with primary data rather than opinion, it keeps ranking and getting cited years after publication. This is the clearest example of data doing double duty: it picks the topic and it becomes the content.
4. HubSpot’s pillar-and-cluster architecture. Rather than publishing isolated posts, HubSpot maps a pillar page (broad topic, high search volume) to a cluster of supporting articles that each target a narrower intent, then links them internally so authority flows to the pillar. Search Console data on which cluster pages capture featured snippets or “People Also Ask” boxes feeds back into which subtopics get expanded next.
5. Toro’s product-first content pivot. Grow and Convert’s case study on Toro TMS documents a shift from generic industry content to deeply specific, buyer-problem content mapped directly to product pages. The pattern: every article answered a question a real prospect asked a salesperson, not a question a keyword tool suggested.
Statistic callout: A slide-in CTA driven by behavioural testing data lifted newsletter signups significantly (https://business.adobe.com/blog/basics/data-driven-marketing-examples), while a single change to video autoplay settings improved product views notably. Small mechanical changes, tested properly, often outperform a full content rewrite.
6. Interactive skin-analysis quizzes (Colgate/Sanex-style). Beauty and personal-care brands increasingly use short interactive assessments, an online skin or oral-health quiz, to capture first-party intent data at the exact moment a visitor is deciding what to buy. The quiz result doubles as personalised content and a segmentation trigger for follow-up email. The data collected (skin type, concern, product history) then shapes the next round of blog and product content.
7. Geotargeted, demographic-led local content (Triggerbee/GreenPal-style). Local-service marketplaces often build landing pages and blog content around hyper-specific location and demographic combinations, “lawn care in [suburb],” “dog walkers near [postcode],” using search and CRM data to prioritise which combinations get a dedicated page versus a shared one. The signal is search volume crossed with existing customer density.

8. Internal data journalism for earned links (OKCupid/Grubhub-style). Some of the most linked-to content in any niche comes from publishing a brand’s own anonymised behavioural data as a standalone study, dating apps analysing message response rates, food delivery platforms analysing order patterns by weather or day of week. Journalists cite these because they’re primary data, not opinion, which builds backlinks and AI-visibility citations simultaneously.

9. Product-led blog-to-landing-page funnels. B2B software content increasingly follows a strict funnel logic: a blog post solving a narrow technical problem links directly to the product feature that solves it, with the CTA copy pulled from actual support-ticket language rather than marketing copy. Conversion data on which blog-to-product paths convert best determines which topics get expanded into pillar content.
10. A compact in-house A/B test. You don’t need Toro’s scale to run this: pick one high-traffic page, split traffic between two headline or CTA variants using your existing testing platform, and measure conversion rate over a fixed two-to-four-week window with a minimum sample size defined before you start. Document the result either way. A negative test still tells you what not to scale.
How to build a data-driven content workflow step by step
Replicating these examples requires a repeatable process, not a one-off campaign.
- Collect signals before you brief anything. Pull search demand (keyword tools, Search Console queries and impressions), on-page behaviour (scroll depth, exit rate), CRM and loyalty data (what converts, what churns), session recordings, and, increasingly, AI visibility, whether your brand shows up when someone asks ChatGPT or Perplexity about your category.
- Build a brief template with four fixed fields. Search or business intent, required format (list, comparison, calculator, guide), the evidence the writer must include (a stat, a named framework, an internal data point), and at least one element built for AI citation, a clear definition early, a named figure with its source.
- Assign interviews, not just research. The Toro-style pivot worked because writers interviewed salespeople about real buyer objections, not because they read more competitor blogs.
- Map every piece to a conversion path before publishing. Decide which product page, lead form, or social media KPI the content should influence, and link to it directly in the body.
- Design a distribution test alongside the content, not after it. Ten Speed’s guidance on treating distribution as a core system is worth following closely: test channel, timing, and format as deliberately as you test the headline.
Pro Tip: Set your distribution test variables (channel, day, format) before you publish, not after the numbers come in flat. Retrofitting a test to a disappointing result almost always produces a biased read.
Measuring success: KPIs, attribution and reporting that prove ROI
Pipeline contribution, revenue influence, and conversion rate should sit above every other metric on your dashboard. Everything else is supporting evidence.
- Primary KPIs: pipeline contribution (how many opportunities touched this content), revenue influence (directional, not exact, in most multi-touch models), and conversion rate on the specific page or asset.
- Supporting engagement metrics: scroll depth, repeat visits, and time on page tell you whether content is being consumed, not whether it’s making money, so treat them as diagnostic, not primary.
- Attribution approach: Siteimprove warns that failing to connect content to measurable business outcomes is one of the most common and costly mistakes teams make, and recommends a framework that links content directly to lead generation and revenue data inside the CRM, whether that’s first-touch, last-touch, or a blended multi-touch model.
- Cadence: review top-funnel content monthly and revenue-adjacent content (pillar pages, comparison pages) quarterly, with a refresh trigger whenever a page drops out of the top three ranking positions for its primary query.
| Metric type | What it tells you |
|---|---|
| Pipeline contribution | Which content touched an opportunity before it became a qualified lead. |
| Revenue influence | Directional signal on how content spend maps to closed revenue. |
| Conversion rate | Whether a specific page or asset turns visitors into signups or leads. |
| Scroll depth / repeat visits | Whether content is genuinely consumed, useful diagnostically, not for ROI claims. |
Common pitfalls and quick fixes
Most data-driven content programmes fail for the same handful of reasons.
- Vanity metrics disguised as success. Traffic and pageviews mean nothing without a tie back to pipeline or conversion; fix this by naming the business outcome before you write the brief, not after.
- Distribution bolted on afterwards. Treating distribution as an afterthought, rather than part of the content system itself, wastes good content on the wrong channel or timing.
- No record of test confidence. Document sample size and test duration for every experiment, even informal ones, so a lucky week doesn’t get mistaken for a real trend.
- Chasing volume over refreshing winners. Content Marketing Institute recommends focusing on topic-level signals and updating your best-performing pages before publishing net-new ones.
Pro Tip: Before greenlighting a new content topic, check whether an existing page already ranks for a related query and simply needs updated data. Refreshing a page that ranks position six is usually faster than building a new one from zero.
Where Greediersocialmedia fits into the data-driven picture
Greediersocialmedia has worked with UK-based creators and small businesses since 2013, supporting more than a million users, and that scale gives a practical view of how engagement signals actually move audience trust.
- Format testing across Instagram, TikTok, and YouTube shows which post types earn genuine interaction before a brand invests further in that format.
- The gap between purchased visibility and organic momentum is a live debate in social strategy, and Greediersocialmedia’s own comparison of authentic engagement against inflated metrics sets out where each approach fits a growth plan.
A brand’s early social proof, real followers, genuine likes, honest view counts, often decides whether the next piece of content gets a fair chance to be seen at all. Getting that foundation right first is what makes later content experiments worth running.
If you’re weighing up how to build that foundation before layering on content experiments, Greediersocialmedia’s social media growth tactics page covers practical starting points for UK businesses and creators.
What the evidence actually tells you to do first
The conventional advice, “just publish more,” is precisely backwards.
Where most teams go wrong is treating data collection and content production as separate phases handled by separate people. The Toro case worked because interviews with salespeople fed directly into briefs; the Adobe test worked because the same team that saw the analytics wrote the experiment. Split those functions across departments and the feedback loop dies.
If you’re starting from nothing, prioritise first-party behavioural data over search-volume tools. Search data tells you what people ask; CRM and loyalty data tell you what they actually do, and that second signal is harder to fake and rarer to find in your competitors’ content.
Sources
- Data-driven marketing examples (Adobe Business blog)
- Content distribution should be part of the core system (Ten Speed)
- Data-driven content marketing (Siteimprove)
FAQ
What are data-driven strategies?
A data-driven strategy uses measurable evidence, search demand, behavioural data, or test results, to guide decisions rather than relying on assumption or precedent alone.
What are examples of content strategies?
Examples include pillar-and-cluster architecture (HubSpot), loyalty-based personalisation, and product-led content mapped to buyer problems (Toro), each guided by a different type of data.
What is an example of a data strategy?
Ahrefs’ approach of publishing original studies built from its own keyword and crawl data is a clear example: the data source becomes both the research method and the content itself.
What are the 5 pillars of content strategy?
Definitions vary across the industry, but a commonly cited version includes audience research, content planning, creation, distribution, and measurement, all of which this article’s examples touch on directly.