

A growing follower count can hide an audience that is quietly shrinking. Tracking follower drop-off rate means measuring the share of your starting followers who leave during a set period: divide the number lost by your follower count at the start, then multiply by 100. The percentage puts losses in context, rather than showing only a raw number.
It’s easy to focus on new followers, but people who leave also shape your account’s growth. A rise in drop-off doesn’t reveal the cause by itself, but it gives you a clear signal to investigate.
This guide explains what follower drop-off rate means and how to calculate it. You’ll also learn to read changes in time-series charts, compare trends across periods and understand how consistent tracking can support more informed decisions about your audience.
Key Takeaways
- Calculate the share of followers lost against the starting count to put audience changes in context.
- Use time-series charts to spot when losses rise or ease, then investigate the points that stand out.
- Separate a follower leaving from a user ending their entire visit; a drop-off can happen while they continue elsewhere.
- See how Instagram follower and like options from Greedier Social Media may fit your next audience-growth step.
1. Drop-off rate calculation
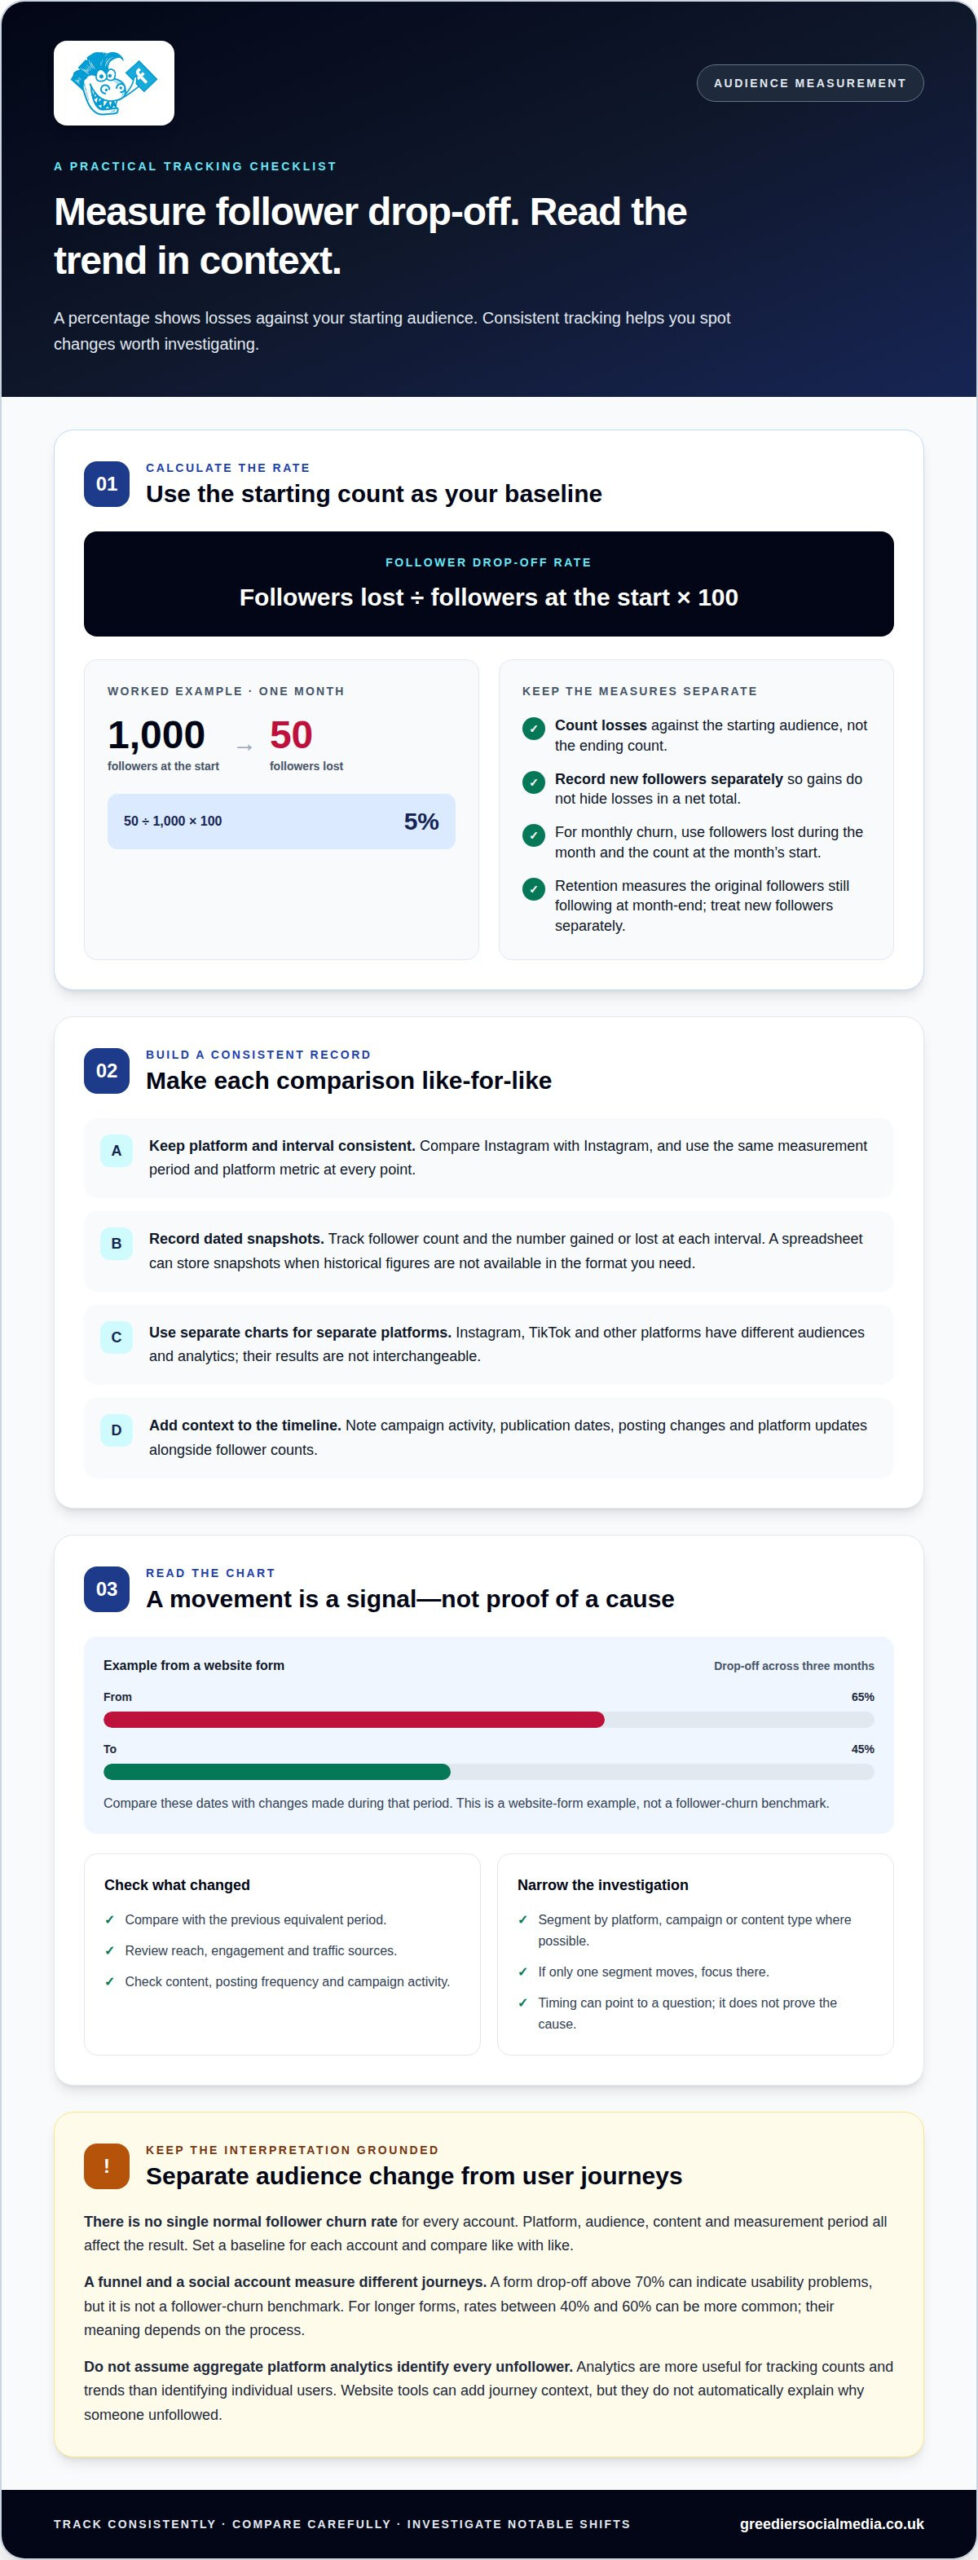
Follower drop-off rate is the share of followers lost from a starting audience over a defined period. Calculate it by dividing followers lost by followers at the start, then multiplying by 100. Keep the platform and measurement period consistent so each comparison uses the same basis.
For example, if an account starts a month with 1,000 followers and loses 50, the rate is 50 ÷ 1,000 × 100, or 5%. This measures losses against the starting count, not the ending count. Record new followers separately, since gains can hide losses in a net total.
For a funnel, divide the users who leave a particular journey by those who started it, then multiply by 100. An onboarding flow with 200 starters and 78 finishers loses 122 users, giving a 61% drop-off rate. A form drop-off rate uses the same method: count people who start but abandon before completion.
Platform audiences behave differently, so compare Instagram with Instagram and TikTok with TikTok rather than treating their results as interchangeable. Posting patterns, audience expectations and platform features can all affect the changes you observe. The calculation stays the same; the context for interpreting it does not.
Instagram, TikTok, Facebook and X may show aggregate follower changes, but don’t assume they provide a reliable list of every account that unfollowed you. Analytics are more useful for tracking counts and trends than identifying individual users.
To calculate monthly churn, divide followers lost during the month by followers at the month’s start, then multiply by 100. Retention is the share of that starting audience still following at month-end: divide remaining original followers by the starting count and multiply by 100. Treat new followers separately.
To connect losses with posts or campaigns, log publication dates and campaign activity alongside follower counts. Compare when changes occurred with specific content, while considering other changes during the same period. To support retention, review audience feedback, keep content relevant and make your account’s subject clear.
2. Analysing drop-offs with time-series charts
A time-series chart plots follower losses or drop-off rates across dates. Choose a consistent interval, such as weekly or monthly, and use the same platform metric for every point. This makes sudden rises, gradual changes and recurring patterns easier to spot. Add notes about campaigns, posting changes or platform updates to put each movement in context. A chart can make tracking follower drop-off rate over time easier to interpret.
To track losses, record the follower count and the number gained or lost at each interval. Keep Instagram, TikTok and other platforms on separate charts because their audiences and analytics differ. Where available, use each platform’s native analytics as your data source. A spreadsheet can store dated snapshots if historical figures aren’t available in the format you need. Consistent tracking of follower drop-off rate also makes comparisons clearer.
For a website funnel, analytics tools show where users who start stop progressing. Google Analytics 4 funnel reports can reveal stages with missing events, so audit event tracking before interpreting a chart. Real-time analytics can show activity as it happens, but use consistent reporting windows for meaningful comparisons. Inconsistent event tracking can make a genuine change look like a measurement problem.
Session recordings show user actions during a website visit, while on-page feedback captures users’ stated concerns. Form analytics can highlight fields that cause effort or confusion. These tools add context to the user journey, but they don’t automatically reveal why someone unfollowed an account.
Third-party unfollower tools are subject to platform permissions and data rules, so don’t assume they can reliably identify individual accounts. UK analytics tool costs depend on features, data access and plan structure. Assess those factors against your needs.
Read chart changes as signals, not proof. If a form’s drop-off falls from 65% to 45% over three months, compare those dates with changes made during that period. Apply the same disciplined comparison to follower trends, then investigate notable shifts before deciding what action to take.
3. Why tracking drop-off rates matters
Follower counts show audience size, while drop-off rates add context. They help distinguish steady growth from a pattern in which new follows arrive alongside regular losses. Compare the same platform across consistent periods, then note changes in content, posting frequency or campaign activity. This gives each percentage clearer business meaning.
There isn’t one normal follower churn rate for every social media account. Platform, audience, content and measurement period all affect the result. Set a baseline for each account, then compare like with like. Don’t judge a change on Instagram automatically against TikTok or another account’s figures.
Interpret each movement alongside reach, engagement and traffic sources. For example, a rise in unfollows after a campaign may coincide with a shift in audience or content. That timing is a reason to investigate, not proof of cause. Segment results by platform, campaign or content type where your analytics tool allows it.
Drop-off analysis also helps prioritise attention. A website funnel and a social account measure different journeys: a form drop-off above 70% can indicate usability problems, but it isn’t a follower-churn benchmark. Keep those metrics separate. For longer forms, rates between 40% and 60% can be more common, yet their meaning depends on the process.
Use a consistent review routine: compare each period with the previous equivalent period, check whether reach or posting activity changed, then inspect the relevant content. If losses rise while traffic and engagement also shift, consider whether the audience reaching your posts has changed. If only one segment moves, focus your investigation there.
These checks turn a percentage into a practical signal. They can show whether a change is broad or limited to one platform, campaign or content type. Record the result alongside its context. The next comparison can then show whether the pattern continued, reversed or followed another change.
4. Definition of drop-off rate
A drop-off rate is the percentage of people who start a defined journey but don’t complete its intended action. The journey might involve following an account, completing a form or moving from one website screen to another. Define the starting group, end point and measurement period first; otherwise, the percentage may describe different behaviours each time.
For example, 300 of 1,000 people leave a signup process before completion, producing a 30% drop-off rate. In a funnel, calculate each step separately: this reveals where visitors stop progressing, rather than only showing how many reach the final conversion. A drop-off doesn’t always mean someone has left the site; they may simply have stopped completing the journey being measured.
That distinction matters. An exit rate identifies the page where a visitor ends their site visit, while drop-off describes failure to complete a particular journey or action. Bounce rate is another measure of how visitors engage with a page. These measures can overlap, but they answer different questions.
A screen-level example makes the difference clear. If 1,000 visitors view a homepage and 400 click “learn more”, the first step has a 60% drop-off. If only 120 of those 400 continue browsing, the next step has a 70% drop-off. The conversion rate records completed actions; drop-off shows the share that didn’t progress.
For social accounts, define the action as following and compare follower counts over the same period. A net count alone can hide losses when new followers arrive at the same time. Treat the percentage as a signal, not an explanation: it identifies a change, while content, audience shifts or friction may help explain it.
To test a possible cause, compare two versions of a page or journey while keeping the measured action consistent. This helps show whether a change affects progression, though it doesn’t explain every individual decision. For a separate step towards Instagram audience growth, explore Instagram growth options.
Greedier Social Media
Greedier Social Media offers Instagram Followers, Instagram Likes, Auto Instagram Followers and Auto Instagram Likes for people looking to support their account’s audience and engagement goals. These options can complement regular drop-off monitoring, but they don’t explain why followers leave or replace reviewing audience behaviour.
Use the figures you’ve tracked to guide your next decision. If you’re building your Instagram audience, consider whether follower or like options align with your current goals. If your priority is understanding a rise in unfollows, first compare account trends and review relevant content. Keeping measurement and growth decisions distinct helps you assess each clearly.
For information about the available options, contact Greedier Social Media.
Make your next audience decision with confidence
Let the pattern guide your next step rather than reacting to every fluctuation. Note what changed, what stayed consistent and what you want to learn from the next review. Over time, tracking follower drop-off rate can bring more structure to decisions about your account and audience.
Keep your approach practical. Choose a clear objective, review account data alongside your content plans, and adjust when the evidence points to a useful change. If you’re considering additional support for your Instagram growth goals, explore the options from Greedier Social Media.
Contact Greedier Social Media to discuss your next step. Keep learning from your audience, and build your plans with purpose.
Frequently Asked Questions
What is Drop off rate?
Drop-off rate describes the proportion of people who start an activity but don’t complete its intended action. For a social account, define the activity as following over a chosen period. Keep it distinct from net follower change: an account can gain followers overall while some existing followers leave. This explains why a rising total doesn’t always mean everyone is staying.
What are the reasons for drop-offs?
Drop-offs can follow a mismatch between what people expected and what they experienced. For a social account, review whether recent posts changed subject, tone or frequency, and whether a campaign attracted a different audience. These are possible explanations, not proof. Compare follower-loss dates with publishing and campaign records, then look for repeated patterns before changing your approach.
Which analytics tools track unfollows and follower growth?
Start with the social platform’s own analytics for follower growth and audience trends. Third-party tools may offer extra reporting, but their access to data depends on the platform’s permissions. Don’t assume an app can identify every person who unfollowed you. For a clear comparison, keep dated follower counts and gains or losses in a spreadsheet.
What are common reasons followers unfollow a brand or creator?
Followers may leave when a brand or creator posts content that no longer matches their interests, publishes too often or shifts direction without clear context. Repeated promotional posts can also feel less relevant to an audience seeking useful or entertaining material. Review posts around a change in follower numbers and consider audience feedback before deciding which explanation fits.
How does follower drop-off differ across social media platforms?
The calculation is the same across platforms, but audience behaviour, posting patterns, expectations and platform features can affect the results. Compare each platform with itself rather than treating Instagram, TikTok and other platforms as interchangeable.